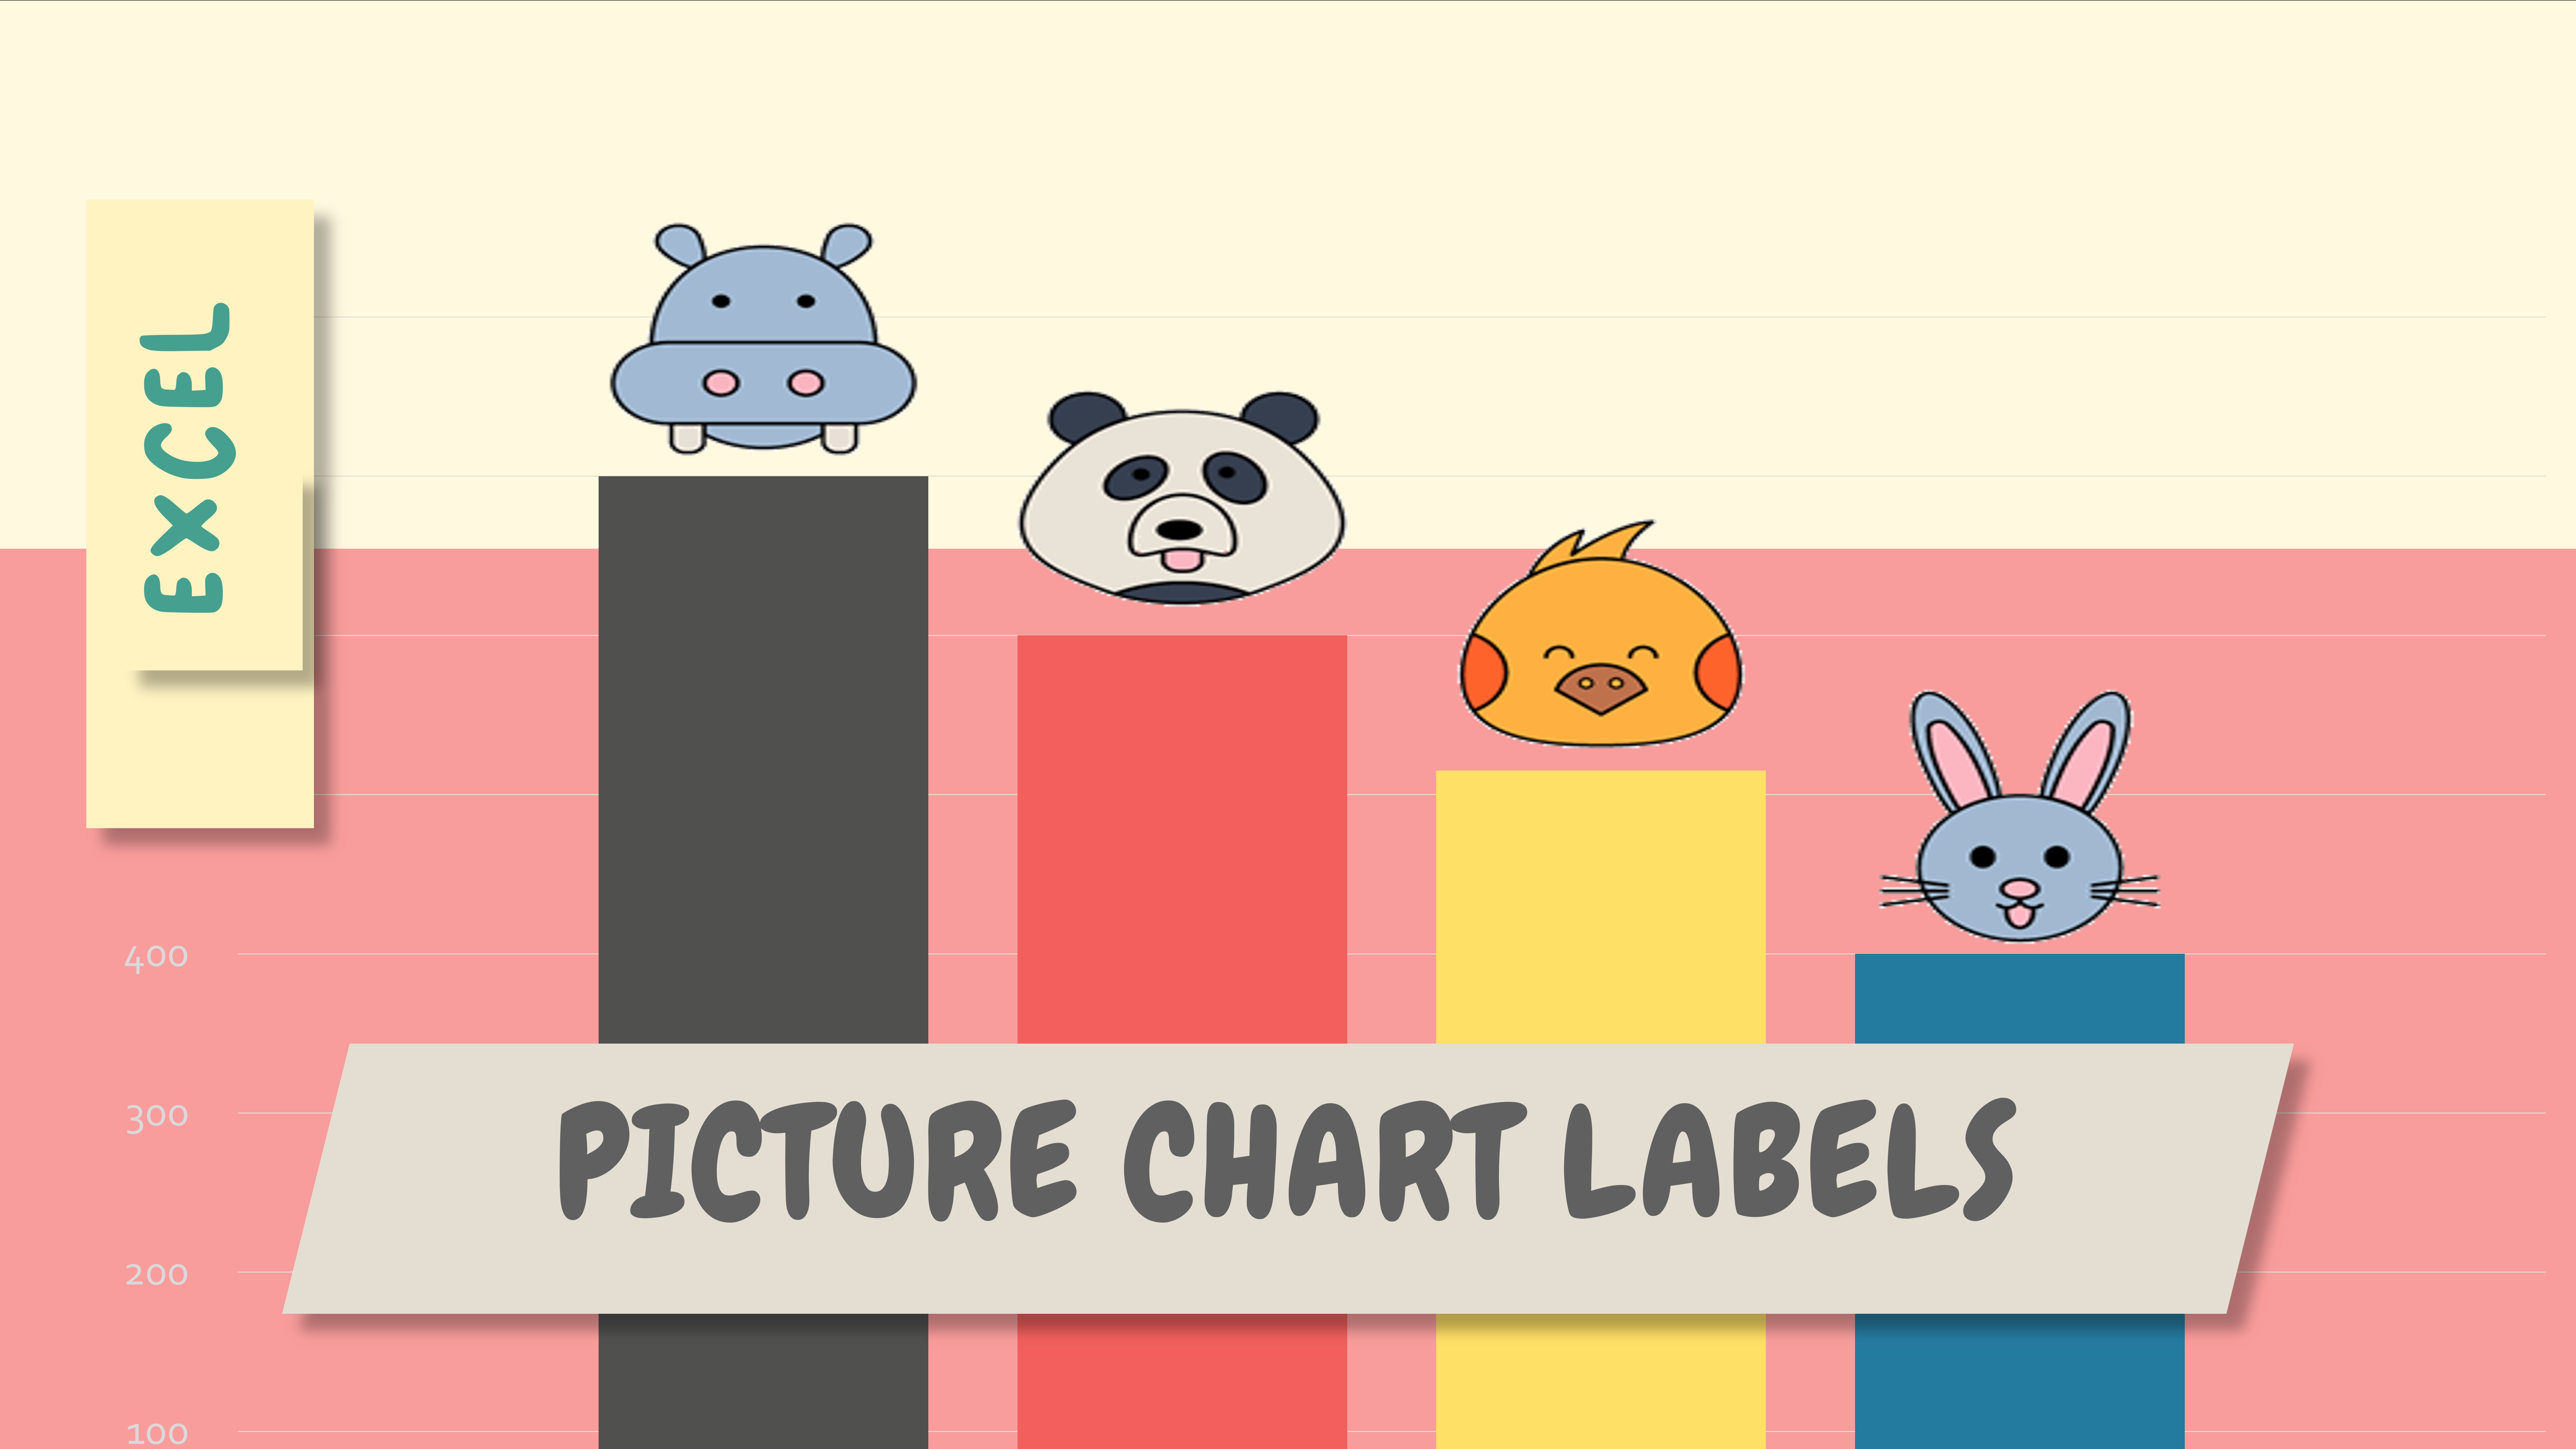
Create Picture Chart Data Labels in Excel
263 views · Nov 18, 2022 computer1001.com
How to use pictures or icons as Excel chart Data Labels. --------------------------------------------------- Free Fonts, Backgrounds & Illustrations: ● Creative Fabrica: https://www.creativefabrica.com/ref/2... --------------------------------------------------- Websites & Social Media: ● Template: https://template.computer1001.com/ ● Tutorial: https://www.computer1001.com/ ● Twitter: https://twitter.com/computer1001 ● Pinterest: https://www.pinterest.com/templatecomputer1001 ---------------------------------------------------
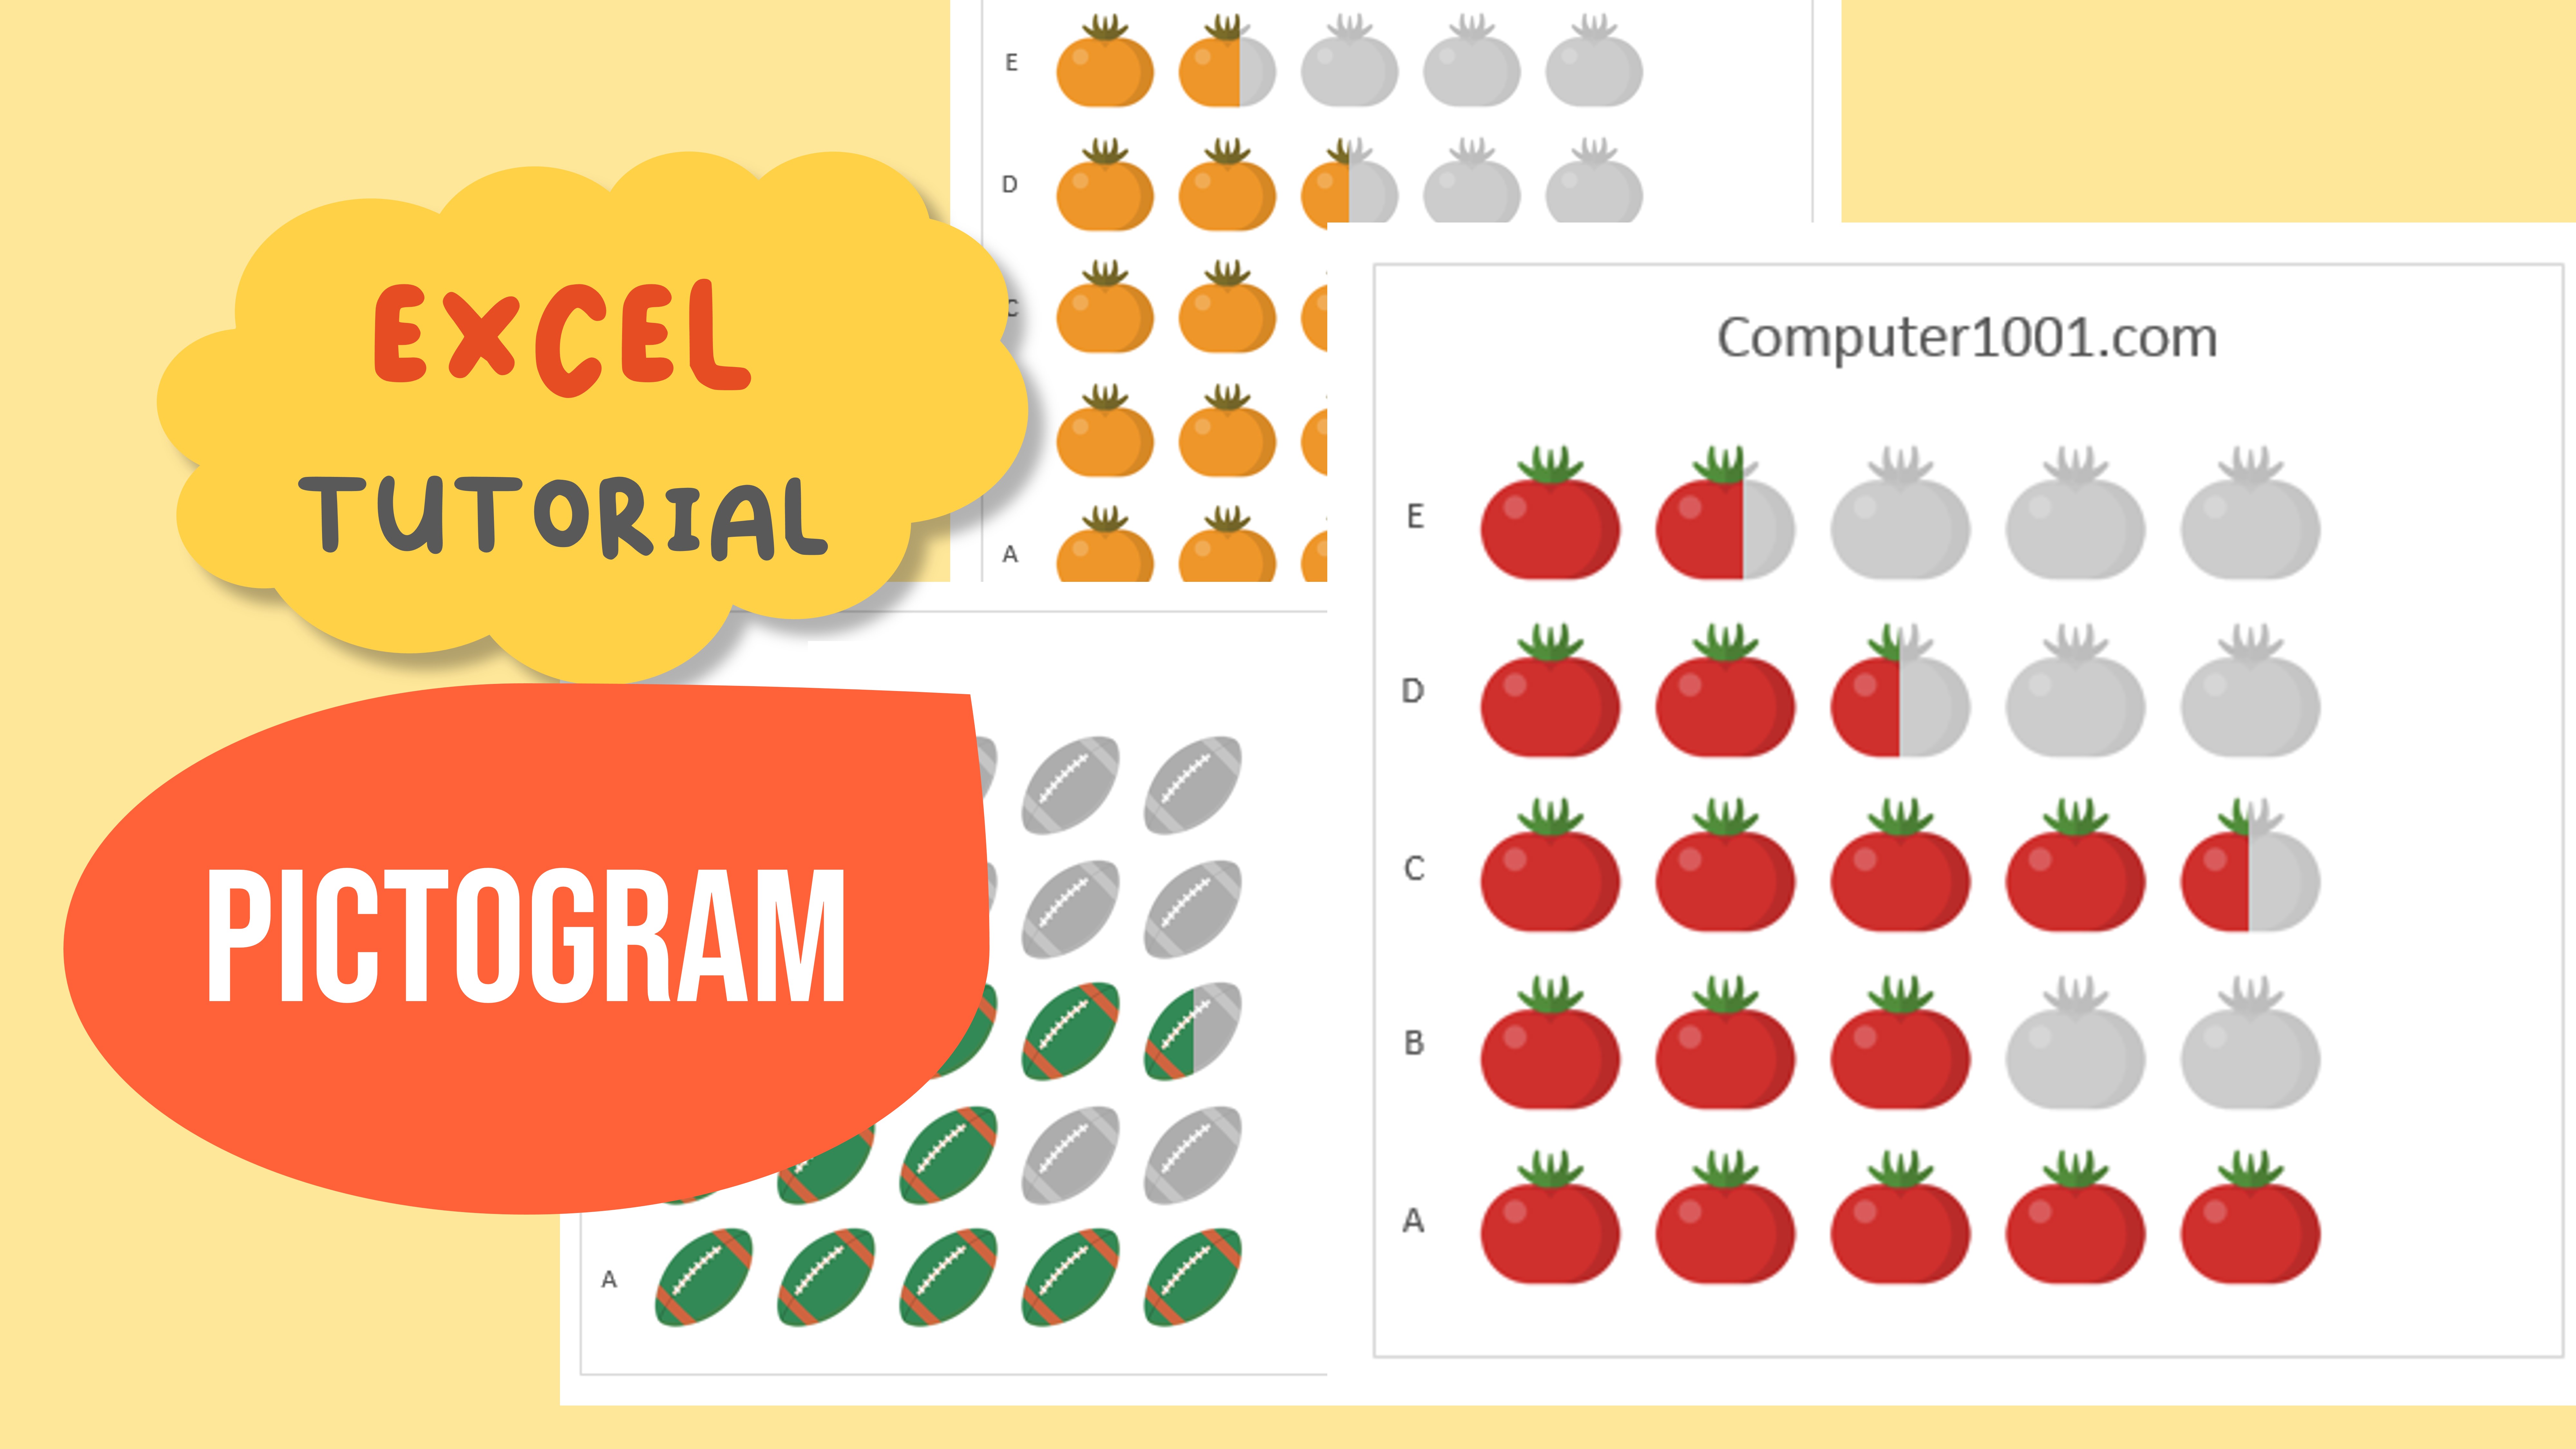
Create a Two Color Pictogram in Excel
94 views · Nov 18, 2022 computer1001.com
This tutorial shows you how to create a two color pictogram in Excel. A pictogram is a chart or graph which uses icons, symbols, or pictures to represent data. Pictogram also known as isotype chart, pictograph, icon chart, pictorial unit chart, or picture graph. --------------------------------------------------- Free Fonts, Backgrounds & Illustrations: ● Creative Fabrica: https://www.creativefabrica.com/ref/2... --------------------------------------------------- Websites & Social Media: ● Template: https://template.computer1001.com/ ● Tutorial: https://www.computer1001.com/ ● Twitter: https://twitter.com/computer1001 ● Pinterest: https://www.pinterest.com/templatecomputer1001 ---------------------------------------------------